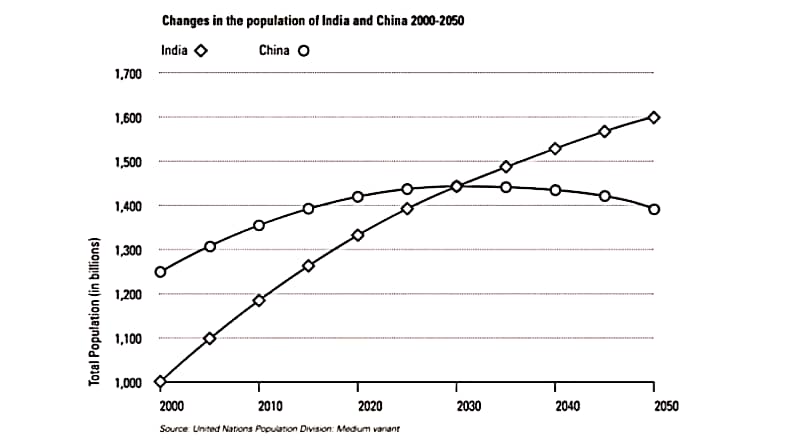
This graph illustrates a comparison between the chane of the populations, shown in billions, of India and China starting from the year 2000 to the present day with predictions for the growth to the year 2050.
Population of China has a constant increase with change of speed on growth. The population increases from 1,000 to a value between 1,300 and 1,400 from the year 2000 to the present day. The predictions show the values will increase to 1,600 till the year 2050.
Population of India increases slowly from a value between 1,200 and 1,300 to a value bit over 1,400. Then, as it gets to its highest value, which is between 1,400 and 1,500, it starts to decrease, involving the predictions, to a value a bit lower than 1,400 till the year 2050.
From the graph, how the growth of the population of China is both higher and more constant than the population growth of India, which has a slower increase, then a decrease can be seen. In addition, the total population of both China and India hit a value between 1,400 and 1,500 on 2030-based predictions.

